A) $14.
B) $10.
C) $8.
D) $6.
Correct Answer

verified
Correct Answer
verified
Multiple Choice
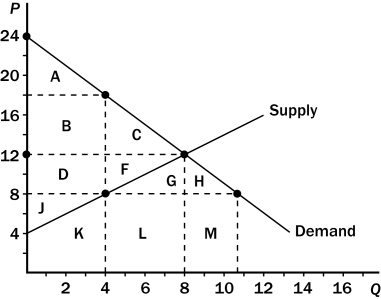
Figure 8-8
Suppose the government imposes a $10 per unit tax on a good.  -Refer to Figure 8-8.The decrease in consumer and producer surpluses that is not offset by tax revenue is the area
A) C.
B) F.
C) G.
D) C+F.
Correct Answer

verified
Correct Answer
verified
Multiple Choice
Scenario 8-2 Tom mows Stephanie's lawn for $25.Tom's opportunity cost of mowing Stephanie's lawn is $20,and Stephanie's willingness to pay Tom to mow her lawn is $28. -Refer to Scenario 8-2.Assume Tom is required to pay a tax of $10 each time he mows a lawn.Which of the following results is most likely?
A) Stephanie now will decide to mow her own lawn,and Tom will decide it is no longer in his interest to mow Stephanie's lawn.
B) Stephanie still is willing to pay Tom to mow her lawn,but Tom will decline her offer.
C) Tom still is willing to mow Stephanie's lawn,but Stephanie will decide to mow her own lawn.
D) Tom and Stephanie still can engage in a mutually-agreeable trade.
Correct Answer

verified
Correct Answer
verified
True/False
Total surplus in a market does not change when the government imposes a tax on that market because the loss of consumer surplus and producer surplus is equal to the gain of government revenue.
Correct Answer

verified
Correct Answer
verified
Multiple Choice
The graph that represents the amount of deadweight loss (measured on the vertical axis) as a function of the size of the tax (measured on the horizontal axis) looks like
A) a U.
B) an upside-down U.
C) a horizontal straight line.
D) an upward-sloping curve.
Correct Answer

verified
Correct Answer
verified
True/False
The deadweight loss of a tax rises even more rapidly than the size of the tax.
Correct Answer

verified
Correct Answer
verified
Multiple Choice
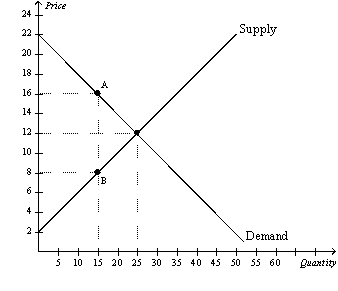
Figure 8-7
The vertical distance between points A and B represents a tax in the market.  -Refer to Figure 8-7.Before the tax is imposed,the equilibrium price is
A) $16,and the equilibrium quantity is 15.
B) $12,and the equilibrium quantity is 15.
C) $12,and the equilibrium quantity is 25.
D) $8,and the equilibrium quantity is 15.
Correct Answer

verified
Correct Answer
verified
Multiple Choice
Which of the following quantities decrease in response to a tax on a good?
A) the equilibrium quantity in the market for the good,the effective price of the good paid by buyers,and consumer surplus
B) the equilibrium quantity in the market for the good,producer surplus,and the well-being of buyers of the good
C) the effective price received by sellers of the good,the wedge between the effective price paid by buyers and the effective price received by sellers,and consumer surplus
D) None of the above is necessarily correct unless we know whether the tax is levied on buyers or on sellers.
Correct Answer

verified
Correct Answer
verified
Multiple Choice
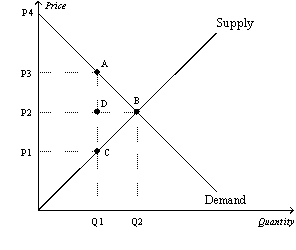
Figure 8-3
The vertical distance between points A and C represents a tax in the market.  -Refer to Figure 8-3.The amount of the tax on each unit of the good is
A) P3 - P1.
B) P3 - P2.
C) P2 - P1.
D) P4 - P3.
Correct Answer

verified
Correct Answer
verified
Multiple Choice
Figure 8-2
The vertical distance between points A and B represents a tax in the market.  -Refer to Figure 8-2.The loss of producer surplus for those sellers of the good who continue to sell it after the tax is imposed is
A) $0.
B) $1.
C) $2.
D) $3.
Correct Answer

verified
Correct Answer
verified
Multiple Choice
Which of the following statements about a land tax is correct?
A) A tax on raw land causes no deadweight loss.
B) Landowners bear the entire burden of a tax on raw land.
C) The government's tax revenue exactly equals the loss of the landowners.
D) All of the above are correct.
Correct Answer

verified
Correct Answer
verified
Multiple Choice
Figure 8-6
The vertical distance between points A and B represents a tax in the market.  -Refer to Figure 8-6.When the tax is imposed in this market,buyers effectively pay what amount of the $10 tax?
A) $0
B) $4
C) $6
D) $10
Correct Answer

verified
Correct Answer
verified
Multiple Choice
In the early 1980s,which of the following countries had a marginal tax rate of about 80 percent?
A) United States
B) Canada
C) Japan
D) Sweden
Correct Answer

verified
Correct Answer
verified
Multiple Choice
A tax levied on the buyers of a good shifts the
A) supply curve upward (or to the left) .
B) supply curve downward (or to the right) .
C) demand curve downward (or to the left) .
D) demand curve upward (or to the right) .
Correct Answer

verified
Correct Answer
verified
Multiple Choice
An increase in the size of a tax is most likely to increase tax revenue in a market with
A) elastic demand and elastic supply.
B) elastic demand and inelastic supply.
C) inelastic demand and elastic supply.
D) inelastic demand and inelastic supply.
Correct Answer

verified
Correct Answer
verified
Multiple Choice
Which of the following statements is correct?
A) In 2008,the combined Social Security-Medicare tax amounted to 15.3 percent of a worker's income.
B) The White House budget office has asserted that Social Security and Medicare have promised to pay out $18 trillion more in benefits than they will receive in revenue in coming decades.
C) If payroll taxes are increased to maintain current levels of Social Security and Medicare benefits,an expected result would be fewer hours worked per week by the average American worker.
D) All of the above are correct.
Correct Answer

verified
Correct Answer
verified
Multiple Choice
Figure 8-3
The vertical distance between points A and C represents a tax in the market.  -Refer to Figure 8-3.The price that sellers effectively receive after the tax is imposed is
A) P1.
B) P2.
C) P3.
D) P4.
Correct Answer

verified
Correct Answer
verified
Multiple Choice
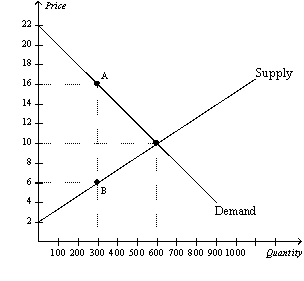
Figure 8-6
The vertical distance between points A and B represents a tax in the market.  -Refer to Figure 8-6.When the government imposes the tax in this market,tax revenue is
A) $600.
B) $900.
C) $1,500.
D) $3,000.
Correct Answer

verified
Correct Answer
verified
Multiple Choice
When a tax is placed on a product,the price paid by buyers
A) rises,and the price received by sellers rises.
B) rises,and the price received by sellers falls.
C) falls,and the price received by sellers rises.
D) falls,and the price received by sellers falls.
Correct Answer

verified
Correct Answer
verified
True/False
When a tax is imposed on buyers,consumer surplus decreases but producer surplus increases.
Correct Answer

verified
Correct Answer
verified
Showing 221 - 240 of 353
Related Exams