A) would likely be made by an economist acting as a policy advisor.
B) would require values and data in order to be evaluated.
C) would require data but not values in order to be evaluated.
D) could not be evaluated by economists acting as scientists.
Correct Answer

verified
Correct Answer
verified
Multiple Choice
You know an economist has crossed the line from scientist to policy adviser when he or she
A) claims that the problem at hand is widely misunderstood by non-economists.
B) talks about the evidence.
C) makes normative statements.
D) makes a claim about how the world is.
Correct Answer

verified
Correct Answer
verified
Multiple Choice
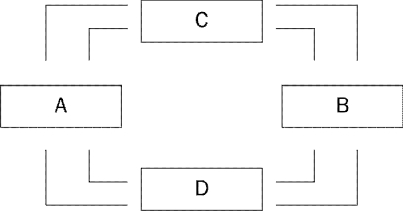
Figure 2-2  -Refer to Figure 2-2.Carla regularly buys fruits and vegetables at a grocery store.Roberto regularly pays a lawn-care company to mow his lawn.If the flow of fruits and vegetables from the grocery store to Carla is represented by an arrow from Box C to Box B of this circular-flow diagram,then the money paid by Roberto to the lawn-care company is represented by an arrow
A) from Box A to Box D.
B) from Box B to Box C.
C) from Box C to Box B.
D) from Box D to Box A.
Correct Answer

verified
Correct Answer
verified
Multiple Choice
Suppose an economy produces two goods,food and machines.This economy always operates on its production possibilities frontier.Last year,it produced 1000 units of food and 47 machines.This year,it is producing 1050 units of food and 52 machines.Which of the following events could not explain the increase in output?
A) a reduction in unemployment
B) an increase in available labor
C) an improvement in technology
D) Any of these events could explain the increase in output.
Correct Answer

verified
Correct Answer
verified
Multiple Choice
One thing economists do to help them understand how the real world works is
A) make assumptions.
B) ignore the past.
C) try to capture every aspect of the real world in the models they construct.
D) All of the above are correct.
Correct Answer

verified
Correct Answer
verified
Multiple Choice
In the ordered pair (20,100) ,20 is the
A) x-coordinate.
B) y-coordinate.
C) scatterplot.
D) slope.
Correct Answer

verified
Correct Answer
verified
Multiple Choice
The field of economics is traditionally divided into two broad subfields,
A) national economics and international economics.
B) consumer economics and producer economics.
C) private sector economics and public sector economics.
D) microeconomics and macroeconomics.
Correct Answer

verified
Correct Answer
verified
Multiple Choice
Which of the following is an example of a positive,as opposed to normative,statement?
A) Income tax rates should not have been cut as they were a few years ago.
B) The quantity of money has grown too slowly in recent years.
C) When the quantity of money grows rapidly,inflation is a predictable consequence.
D) All of the above are positive statements.
Correct Answer

verified
Correct Answer
verified
True/False
Economists work both inside and outside the administrative branch of the U.S.government.
Correct Answer

verified
Correct Answer
verified
Short Answer
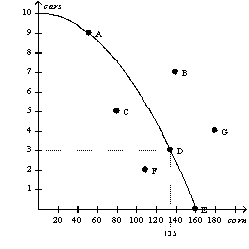
Figure 2-2  Consider the production possibilities curve for a country that can produce cars,corn (in bushels),or a combination of the two.
-Refer to Figure 2-2.Which point(s)on the graph show unemployment of resources?
Correct Answer

verified
Correct Answer
verified
True/False
The opportunity cost of something is what you give up to get it.
Correct Answer

verified
Correct Answer
verified
Multiple Choice
Economists view normative statements as
A) prescriptive,making a claim about how the world ought to be.
B) descriptive,making a claim about how the world is.
C) statements about the normal condition of the world.
D) pessimistic,putting the worst possible interpretation on things.
Correct Answer

verified
Correct Answer
verified
Multiple Choice
Figure 2-8
 -Refer to Figure 2-8,Panel (a) and Panel (b) .A shift of the economy's production possibilities frontier from Panel (a) to Panel (b) could be caused by
A) unemployment.
B) an improvement in donut production technology.
C) an improvement in coffee production technology.
D) an improvement in both donut and coffee production technology.
Correct Answer

verified
Correct Answer
verified
Multiple Choice
A production possibilities frontier can shift outward if
A) government increases the amount of money in the economy.
B) there is a technological improvement.
C) resources are shifted from the production of one good to the production of the other good.
D) the economy abandons inefficient production methods in favor of efficient production methods.
Correct Answer

verified
Correct Answer
verified
Multiple Choice
John Maynard Keynes referred to economics as an easy subject,
A) at which very few excel.
B) but not as easy as philosophy or the pure sciences.
C) which very few can enjoy.
D) which deals primarily with common sense.
Correct Answer

verified
Correct Answer
verified
Multiple Choice
Figure 2-13  -Refer to Figure 2-13.Taking cause and effect into account,which of the following interpretations would be most reasonable regarding the relationship between coffee and hours without sleep?
A) The less coffee a person drinks per day,the more time he can go without sleep.
B) There is no relationship between how much coffee per day a person drinks and how long he can go without sleep.
C) The more coffee a person drinks per day,the more time he can go without sleep.
D) The more coffee a person drinks per day,the less time he can go without sleep.
Correct Answer

verified
Correct Answer
verified
Multiple Choice
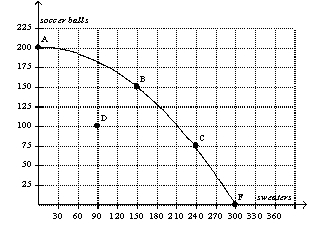
Figure 2-5  -Refer to Figure 2-5.If this economy devotes one-half of its available resources to the production of soccer balls and the other half to the production of sweaters,it could produce
A) 150 sweaters and 100 soccer balls.
B) 150 sweaters and 150 soccer balls.
C) 300 sweaters and 200 soccer balls.
D) We would have to know the details of this economy's technology in order to determine this.
Correct Answer

verified
Correct Answer
verified
True/False
All scientific models,including economic models,simplify reality in order to improve our understanding of it.
Correct Answer

verified
Correct Answer
verified
Multiple Choice
In constructing models,economists
A) leave out equations,since equations and models tend to contradict one another.
B) ignore the long run,since models are useful only for short-run analysis.
C) sometimes make assumptions that are contrary to features of the real world.
D) try to include every feature of the economy.
Correct Answer

verified
Correct Answer
verified
Multiple Choice
Figure 2-16
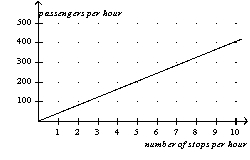
In the following graph the x-axis shows the number of times a commuter rail train stops at a station per hour and the y-axis shows the number of commuter rail passengers per hour.
Commuter Rail Passengers by Frequency of Service  -Refer to Figure 2-16.Which of the following conclusions should not be drawn from observing this graph?
A) There is a positive correlation between the frequency of service and the number of passengers.
B) When there are 5 stops per hour,there are approximately 200 passengers.
C) More stops per hour is associated with more passengers per hour.
D) No other factors besides the frequency of service affect the number of passengers.
Correct Answer

verified
Correct Answer
verified
Showing 301 - 320 of 569
Related Exams